Monitoring as code with Sensu and Ansible

Monitoring as code with Sensu and Ansible

A comprehensive infrastructure as code (IaC) initiative should include monitoring and observability. Incorporating the active monitoring of the infrastructure under management results in a symbiotic relationship in which failures are detected automatically, enabling event-driven code changes and new deployments.

In this post, I'll recap a webinar I hosted with Tadej Borovšak, Ansible Evangelist at XLAB Steampunk (who we collaborated with on our certified Ansible Content Collection for Sensu Go). You'll learn how monitoring as code can serve as a feedback loop for IaC workflows, improving the overall automation solution and how to automate your monitoring with the certified Ansible Content Collection for Sensu Go (with demos!).

Before we dive in, here's a brief overview of Sensu.

About Sensu

Sensu is the turn-key observability pipeline that delivers monitoring as code on any cloud --- from bare metal to cloud native. Sensu provides a flexible observability platform for DevOps and SRE teams, allowing them to reuse their existing monitoring and observability tools, and integrates with best-of-breed solutions --- like Red Hat Ansible Automation Platform. 

With Sensu, you can reuse existing tooling, like Nagios plugins, as well as monitor ephemeral, cloud-based infrastructure, like Red Hat OpenShift. Sensu helps you eliminate data silos by filling gaps in observability --- consolidating tools to bring metrics, logging, and tracing together through the same pipeline, and then distribute them as you like depending on your organizational needs. You can also automate diagnosis and self-healing, with built-in auto-remediation or integrations with products like Red Hat Ansible Automation Platform. 

Why monitoring + automation?

Put simply, monitoring is what you need to be doing nearly continuously to provide actual information about failures and defects. Automation is when you take an action on something --- it's not necessarily a continuous operation. If a failure occurs and you can automate its remediation, then you're saving valuable human time. 

By incorporating the active monitoring of the infrastructure under management, you benefit from a symbiotic relationship in which new metrics and failures are collected and detected automatically in response to code changes and new deployments. We define this concept as monitoring as code, and it's the key to this unified view of the world and management of the entire application lifecycle.

With monitoring as code, you're able to declare monitoring workloads in the same way you declare infrastructure as code with Ansible automation. Infrastructure as code and monitoring as code are on a parallel track, serving different purposes. With the Ansible Content Collection for Sensu Go, you can easily deploy your monitoring, spinning up the backend cluster and putting your agents into the infrastructure as part of provisioning. From there, the monitoring as code aspect takes over: you can update your monitoring without having to reprovision your existing infrastructure every time you want to make a small monitoring change.

Sensu Automation with the Ansible Content Collection for Sensu Go

The Ansible Content Collection for Sensu Go makes it easier for you to create a fully functioning automated deployment of the Sensu Go monitoring agent and backend. The following demo shows a minimal Sensu setup: how to install a backend and two agents, as well as establish a more secure connection, as we'll be passing sensitive information from the backend to the agents. 

Ansible users are likely familiar with the term "inventory." In this case, our inventory file includes two defined groups: the backend group and the agent group. The information in our inventory file tells Ansible how to securely connect our hosts via SSH.

---
all:
  vars:
    ansible_ssh_common_args: >
      -o IdentitiesOnly=yes
      -o BatchMode=yes
      -o UserKnownHostsFile=/dev/null
      -o StrictHostKeyChecking=no
      -i demo
  children:
    backends:
      hosts:
        backend:
          ansible_host: 192.168.50.20
          ansible_user: vagrant
    agents:
      hosts:
        agent0:
          ansible_host: 192.168.50.30
          ansible_user: vagrant
        agent1:
          ansible_host: 192.168.50.31
          ansible_user: vagrant

https://gist.github.com/tadeboro/00cabf8fa79f4c9c90cda8cdf9645f32#file-inventory-yaml

We also need a way to specify which state we want the resource to be in. Enter the Ansible Playbook, which we'll use to set up the backend. It's a YAML file, both human-readable and machine-executable.

---
- name: Install, configure and run Sensu backend
  hosts: backends
  become: true

  tasks:
    - name: Setup secret environment variables
      ansible.builtin.template:
        src: secrets.j2
        dest: /etc/sysconfig/sensu-backend
      vars:
        secrets:
          MY_SECRET: value-is-here

    - name: Install backend
      include_role:
        name: sensu.sensu_go.backend
      vars:
        version: 6.1.0

        cluster_admin_username: >-
          {{ lookup('ansible.builtin.env', 'SENSU_USER') }}
        cluster_admin_password: >-
          {{ lookup('ansible.builtin.env', 'SENSU_PASSWORD') }}
        # mTLS stuff
        agent_auth_cert_file: certs/backend.pem
        agent_auth_key_file: certs/backend-key.pem
        agent_auth_trusted_ca_file: certs/ca.pem

https://gist.github.com/tadeboro/00cabf8fa79f4c9c90cda8cdf9645f32#file-backend-yaml

We'll perform two main functions with this playbook:

  1. Setting environment variables on the backend, where we'll store sensitive information. We'll use Sensu's built-in secrets management to store and share that information securely.
  2. Installing and configuring the Sensu backend. For installation, we'll use the backend Ansible Role, and parameterize it using the variables specified in our file. In this example, we specify what URL to install, how to initialize the database, and how to set up the secure connection that we need to secure communications between the backend and agent.

It's worth noting that this example shows how to keep sensitive information out of your playbooks, making them completely safe to share and commit into your version control system. 

We'll enter the following command to execute the playbook:

ansible-playbook -i inventory.yaml backend.yaml

Although the playbook is relatively short, what Ansible is doing is actually quite complex: adding a repository to the distribution, installing components, copying over TLS certificates, as well as configuring and initializing the backend using the username and password specified. In just under half a minute, we have a Sensu Go backend running! 

We log into the Sensu web UI, but won't see anything yet because we still have to set up our agents, which we'll prepare with our agent playbook. 

---
- name: Install, configure and run Sensu agent
  hosts: agents
  become: true

  tasks:
    - name: Install agent
      include_role:
        name: sensu.sensu_go.agent
      vars:
        version: 6.1.0

        # mTLS stuff
        cert_file: certs/backend.pem
        key_file: certs/backend-key.pem
        trusted_ca_file: certs/ca.pem

        agent_config:
          name: "{{ inventory_hostname }}"
          backend-url:
            - wss://{{ hostvars['backend']['ansible_host'] }}:8081

https://gist.github.com/tadeboro/00cabf8fa79f4c9c90cda8cdf9645f32#file-agent-yaml

It's fairly similar to our backend playbook; the main differences are the host parameter and role name, as we're executing the playbook to install the Sensu agent on the host machine. With the backend playbook, we used the default configuration; with the agent, we need to specify a name so we know how to reference this agent. We also need to specify the backend location. Instead of hard-coding the address of the backend into our playbook, we tell Ansible to fetch this information from the inventory file, which allows us to reuse information we already have stored in our Ansible inventory file. 

To execute the agent playbook and install the agent, I run the same command (switching out the file name):

ansible-playbook -i inventory.yaml agent.yaml

As before, Ansible takes care of everything needed to install the agent, and installation happens concurrently on both machines. 

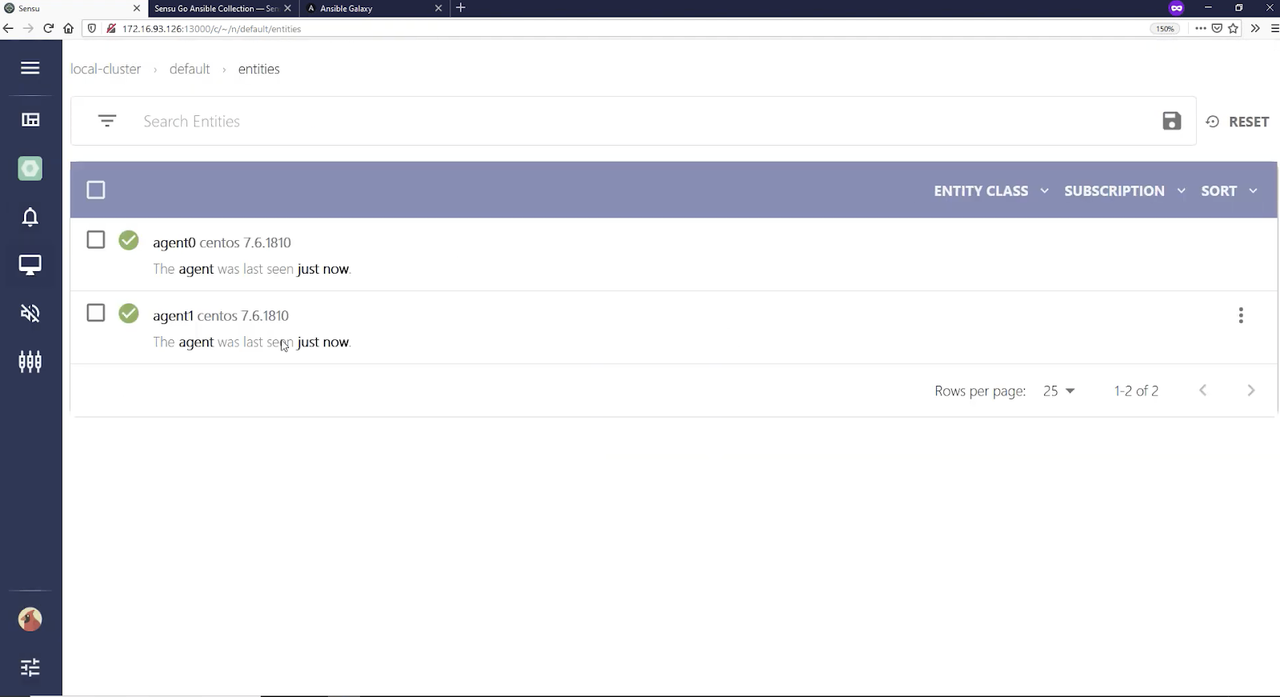
Switching over to the Sensu web UI in the default namespace, under entities, you see our two entities are ready.

Sensu Blog one

Now, we need to configure an event for us to observe. 

Note: as of Sensu Go 6, subscriptions can be updated on the fly, without having to restart the agent.

Here's our Sensu configuration file:

---
- name: Manage Sensu Go resources
  hosts: localhost
  gather_facts: false

  tasks:
    - name: Configure agent subscriptions
      sensu.sensu_go.entity:
        name: agent0
        entity_class: agent
        subscriptions:
          - demo

    - name: Enable env secrets provider
      sensu.sensu_go.secrets_provider_env:
        state: present

    - name: Configures custom secret
      sensu.sensu_go.secret:
        name: my-secret
        provider: env
        id: MY_SECRET

    - name: Create a check that uses secret
      sensu.sensu_go.check:
        name: secret-check
        command: echo $SECRET
        secrets:
          - name: SECRET
            secret: my-secret
        subscriptions: demo
        interval: 10
        publish: true

https://gist.github.com/tadeboro/00cabf8fa79f4c9c90cda8cdf9645f32#file-config-yaml

This is where we tell the agent to listen to the demo subscription and do whatever comes from that. To bring secrets into the check, we need to make sure our secrets provider is ready and register a secret that will fetch its value from the secret environment variable on the backend. Finally, we create a simple check that echoes our secret. 

We run our config playbook:

ansible-playbook -i inventory.yaml config.yaml

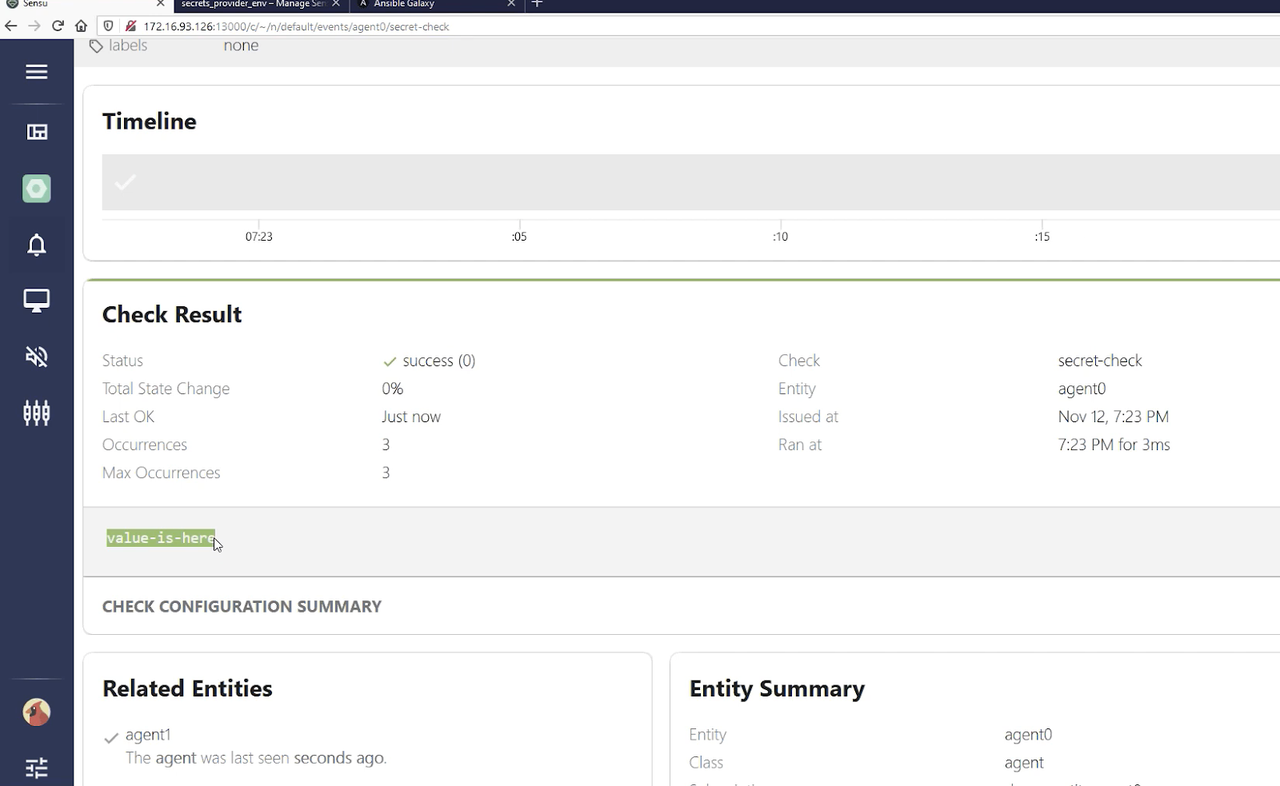
Looking in the Sensu web UI, we can see our agent has gained the demo subscription. Going to events and listing all, you can see that agent-0 executed secret check and our secret value "value-is-here" makes it securely from the backend to the agent. 

sensu blog two

As you can see, our Ansible Content Collection allows you to succinctly describe your infrastructure, letting Ansible deal with the intricacies of setting things up. 

Watch the full demo below:

https://www.youtube.com/watch?v=ShN867iRFvQ

Sensu demo: building a monitoring workflow

Once the Sensu platform is deployed by Ansible, we use Sensu\'s built-in configuration utility - the sensuctl CLI. With sensuctl we can manage the following Sensu API resources: 

  • Entity: agents + proxies
  • Checks: scheduled monitoring workloads run by agents
  • Observability pipelines: filter + transform + process
  • Events: the base data structure Sensu Go pipeline processes
  • Subscriptions: loosely couples check to entities
  • Assets: shareable binaries tos support monitoring workloads; Sensu install at runtime without the need to pre-provision hosts

In this first demo, I'm building a monitoring workflow to create an NGINX service and monitor it to make sure it's up and running. 

As with our earlier demo, I have a set of Ansible Playbooks that quickly create a backend and a single agent. Here, I also set up a check using sensuctl, the command-line tool for managing resources within Sensu. Both the Sensu web UI and sensuctl interact with the same REST API --- sensuctl is just another way to manage Sensu.

We provision the agent so it will communicate to the backend, and I use the Ansible Content Collection to define a new namespace just for this demo --- interacting with the Sensu API to set up a new namespace. I also set up role-based access control (RBAC), which allows me to give access to a user just for auditing (i.e., they don't need to have write access to a namespace). Then, I set up an NGINX host on the same host that the agent is running on.

With our NGINX service up and running, I set up our CLI client with sensuctl configure --insecure-skip-tls-verify (for the purposes of this demo; you wouldn't use this flag in production!). With sensuctl entity list, I can see all our entities and subscriptions available (in our demo, the webinar-agent0). We don't have any checks defined yet, so sensuctl check list doesn't show anything. I use our declarative YAML file to define a check command here called check-http, which is essentially a check to make sure our NGINX service is up and running, using Sensu's dynamic runtime assets to provide that command. The Ansible handler I use in this example has Red Hat Ansible Tower attempt remediation if that service is down. 

Now when I run sensuctl check list I see our check-http. It's in a publish state of false so we have a chance to define and test our check before running it. To run the check once, I run sensuctl execute check-http. (I have an error at first, because I need to add the asset.) You can handle all of these resources via the Ansible Collection for Sensu Go (as opposed to using sensuctl). 

I set up an NTP check, making sure it's using the monitoring plugins runtime asset (which are just builds of monitoring plugins spun off from Nagios plugins). We also have our NGINX check, which is through a Ruby runtime environment that we don't have to pre-provision; the Ruby environment matches that plugin. Again, everything can be handled as part of the Ansible Collection if you want to keep everything inside of Ansible Playbooks.

The NTP and NGINX checks are in a published state running on an interval --- they don't need to be executed individually. Now, when you look at the event list, you see both checks are running. Because the runtime assets are there, these commands (like sensuctl check list) exist in the agent as part of the provisioning that was originally done, without me having to install any additional RPM packages or binaries.

And there you have it: a monitoring workflow that actually works with a service!

Watch the full demo below:

https://www.youtube.com/watch?v=ShN867iRFvQ

Go forth and automate!

Let\'s recap what we\'ve covered so far: we\'ve automated the Sensu backend and agent deployment using the Ansible Content Collection, and we\'ve created some monitoring code (e.g. check-http.yaml) to monitor a service and automate remediation with Ansible Automation Platform. Now let\'s automate management of this monitoring code by connecting it to our CI/CD pipeline via our new best practice workflow called SensuFlow. SensuFlow works with a code repository containing subdirectories of monitoring code that map to Sensu namespaces. SensuFlow provides the following automations:      

  1. Test available of sensu-backend 
  2. Tests provided authentication
  3. Optionally creates namespaces under management (if RBAC policy allows)
  4. Linting of resource definitions to ensure required metadata
  5. Prune deleted/renamed Sensu resources based on label selection criteria
  6. Create and/or modify Sensu resources 

Getting started with SensuFlow is easy, it requires an RBAC profile (User with username and password, ClusterRole and ClusterRoleBinding), and Sensu backend API URL for configuring the Sensu CLI that will run in the CI/CD pipeline. SensuFlow also has a set of optional environment variables that let you customize several operational behaviors, such as the label selection criteria that sensuctl prune uses to delete Sensu resources no longer represented by files in the repository (e.g. if a monitoring code template is deleted or renamed).

To learn more about sensuctl prune, please check out our blog post on https://sensu.io/blog/keep-your-configs-in-good-order-with-sensuctl-prune

SensuFlow is designed to be CI/CD platform agnostic, and can be used locally in your development environment (so long as it has sensuctl, yq and jq installed). But we\'re also actively developing a reference implementation for the GitHub Action CI/CD platform that can be used with any GitHub repository. The SensuFlow GitHub Action effectively provides a direct integration between GitHub and Sensu Go!

Take a look at this monitoring as code example repository, configured to run SensuFlow GitHub action on commit into the main branch. This repository includes several Sensu resources, including the the check and handlers from the Red Hat Ansible Tower remediation example above, but now uses SensuFlow to automate changes in Sensu. 

To learn more about Monitoring as Code and SensuFlow, please check out our recent blog posts and webinar on the topic:

Hopefully this post gave you an idea of what you can do with the monitoring as code concept as well as the Ansible Collection for Sensu Go. For further learning, check out our webinar on self-healing workflows with the Sensu Ansible Tower integration


Deep dive into Trend Micro Deep Security integration modules

Deep dive into Trend Micro Deep Security integration modules

At AnsibleFest 2020, we announced the extension of our security automation initiative to support endpoint protection use cases. If you have missed it, check out the recording of the talk "Automate your endpoint protection using Ansible" on the AnsibleFest page.

Today, following this announcement we release the supported Ansible Content Collection for Trend Micro Deep Security. We will walk through several examples and describe the use cases and how we envision the Collection being used in real world scenarios.

About Trend Micro Deep Security

Trend Micro Deep Security is one of the latest additions to the Ansible security automation initiative. As an endpoint protection solution it secures services and applications in virtual, cloud and container environments. It provides automated security policies and consolidates the security aspects across different environments in a single platform.

How to install the Certified Ansible Content Collection for Trend Micro Deep Security

The Trend Micro Deep Security Collection is available to Red Hat Ansible Automation Platform customers at Automation Hub, our software-as-a-service offering on cloud.redhat.com and a place for Red Hat subscribers to quickly find and use content that is supported by Red Hat and our technology partners.

The blog post "Getting Started with Automation Hub" gives an introduction to Automation Hub and how to configure your Ansible command line tools to access Automation Hub for Collection downloads.

Once that is done, the Collection is easily installed:

ansible-galaxy collection install trendmicro.deepsec

What's in the Ansible Content Collection for Trend Micro Deep Security?

The focus of the Collection is on modules and plugins supporting them: there are modules for interacting with Trend Micro Deep Security agents, like deepsec_firewallrules, deepsec_anti_malware, deepsec_log_inspectionrules and others. Basically the integration modules cover the REST APIs exposed by TM Deep security firewall.  If you are familiar with firewall Collections and modules of Ansible, you will recognize this pattern: all these modules provide the most simple way of interacting with endpoint security and firewall solutions. Using those, general data can be received, arbitrary commands can be sent and configuration sections can be managed.

While these modules provide a great value for environments where the devices are not automated at all, the focus of this blog article is on the endpoint security use-cases where  modules in the respective Collection can help automate. Being modules they have a precise scope, but enable users of the Collection to focus on that particular resource/REST API scenario without being disturbed by other content or configuration items. They also enable a simpler cross-product automation since other security Collections follow the same pattern.

Connect to Trend Micro Deep Security, the Collection way

The Collection supports httpapi as a connection type.

Trend Micro Deep security currently supports two ways for how their REST API can be interacted with, and for each of the respective cases, the Ansible inventory will be changed slightly as mentioned below:

In case of the newer REST APIs the Ansible inventory will work with the network OS trendmicro.deepsec.deepsec, a Trend Micro API secret key and ab api-version key:

[deepsec]
host_deepsec.example.com

[deepsec:vars]
ansible_network_os=trendmicro.deepsec.deepsec
ansible_httpapi_use_ssl=true
ansible_httpapi_validate_certs=false
ansible_connection=httpapi
ansible_python_interpreter=/usr/bin/python
ansible_httpapi_session_key={'api-secret-key': 'secret-key', 'api-version': 'v1'}

In case of APIs using the legacy REST APIs, the Ansible inventory will also require the network OS trendmicro.deepsec.deepsec, but uses a username and a password.

[deepsec]
host_deepsec.example.com

[deepsec:vars]
ansible_network_os=trendmicro.deepsec.deepsec
ansible_user=admin
ansible_httpapi_pass=password
ansible_httpapi_use_ssl=true
ansible_httpapi_validate_certs=false
ansible_connection=ansible.netcommon.httpapi
ansible_python_interpreter=python

Note that in a productive environment those variables should be supported in a secure way, for example, with the help of Red Hat Ansible Tower credentials

Use Case: Firewall Rule Configuration

A firewall is highly flexible and users can configure it to be restrictive or permissive. Like the intrusion prevention and web reputation modules, firewall policies are based on two principles: either they can permit any service unless it is explicitly denied or they deny all services unless explicitly allowed.

For example, using Ansible and Trend Micro Deep Security integration, modules users can take a restrictive firewall approach. This is often the recommended practice from a security perspective: All traffic is stopped by default and only traffic that's explicitly allowed is permitted.

A playbook to implement the "deny all traffic" approach is shown in the following listing:

---
- name: Deny all traffic
  hosts: deepsec
  collections:
   - trendmicro.deepsec
  gather_facts: false
  tasks:
   - name: Create Restrictive firewall rule
     trendmicro.deepsec.deepsec_firewallrules:
       state: present
       name: deny_all_firewallrule
       description: Deny all traffic by default over tcp
       action: deny
       priority: "0"
       source_iptype: any
       destination_iptype: any
       direction: incoming
       protocol: tcp
       tcpflags:
         - syn

Running this play will create a firewall rule that'll explicitly deny all TCP syn bound traffic. Keep in mind that the state keyword is used and set to present. It means that the specified rule is created and that the module will go ahead and create the config rule. On the contrary, if the user wants to delete/drop any specific firewall rule, then the state should be set to absent: in that case, during the play run, the module will check if the specified firewall rule pre-exists and if so the module will go ahead and delete/drop the respective firewall rule config.

Use Case: Antimalware Rule Configuration

Antimalware config helps agents on computers by providing real-time and on-demand protection against a variety of file based threats including malware, viruses, trojans and spyware. Using Ansible deepsec antimalware config module, users can fire all types of available scans:

  • Real-time scan
  • Manual scan
  • Scheduled scan
  • Quick scan

The playbook example we'll be discussing here will be with respect to real time scans as based on incident responses. Users can check for the threats and quarantine the observed threats.

---
- name: Scan and Quarantine in TrendMicro agents
  hosts: deepsec
  collections:
   - trendmicro.deepsec
  gather_facts: false
  tasks:
   - name: Create AntiMalware config
     trendmicro.deepsec.deepsec_anti_malware:
       name: scan_real_time
    description: scan and quarantine via anti-malware config
    scan_action_for_virus: pass
    alert_enabled: true
    scan_type: real-time
    real_time_scan: read-write
    cpu_usage: medium
       scan_action_for_virus: quarantine
       scan_action_for_trojans: quarantine
       scan_action_for_cve: quarantine
       scan_action_for_other_threats: quarantine
    state: present

The playbook listed above will create an antimalware config rule, which will initiate a real-time scan over Trend Micro agents every time there's a file received, copied, downloaded or modified. 

All files will be scanned for any security threats. If during the scan the agents detect any threat based on virus, trojans, cve's and others, the agents will display the information with respect to the infected file and the respective files will be quarantined as specified in the playbook.

Use Case: Log Inspection Rule Configuration

The log inspection integration module helps users to identify events that are generally logged at system/OS level. It also includes application logs. Using the log rule configuration, users can forward the logged events to the SIEM system or to some centralized logging server for analytics, reporting and archiving.

Log inspection helps in real-time monitoring of third parties log files as well. The playbook listed below creates a rule for log inspection.

---
- name: Set up log inspection
  hosts: deepsec
  collections:
   - trendmicro.deepsec
  gather_facts: false
  tasks:
   - name: Create a Log inspection rule
     trendmicro.deepsec.deepsec_anti_malware:
       state: present
       name: custom log_rule for mysqld event
       description: some description
       minimum_agent_version: 6.0.0.0
       type: defined
       template: basic-rule
       pattern: name
       pattern_type: string
       rule_id: 100001
       rule_description: test rule description
       groups:
         - test
       alert_minimum_severity: 4
       alert_enabled: true
       log_files:
         - location: /var/log/mysqld.log
           format: mysql-log
     register: log


Automating a RHEL 8 Installation Using the VMware REST Ansible Collection

Automating a RHEL 8 Installation Using the VMware REST Ansible Collection

Managing virtual machines in an IT infrastructure is often a common task, specifically VMware virtualization technology has been around for over 20 years. VMware administrators spend a lot of their time in automating the creation, management, and removal of virtual instances that contain various operating systems. One operating system that often resides on VMware infrastructure is Red Hat Enterprise Linux. 

With the introduction of VMware REST APIs, we recently announced the initial release of the vmware.vmware_rest Collection, for production use. As opposed to the community.vmware Collection, the vmware.vmware_rest Collection is based on next generation VMware REST APIs.  This new Collection no longer requires any third party Python bindings to communicate with VMware infrastructure. A large part of the new Collection that has been introduced is support for automating virtual machine operations.

In this blog post I will show you how VMware users can automate the installation of Red Hat Enterprise Linux 8 (RHEL 8) using the vmware.vmware_rest.vcenter_vm module and a valid Kickstart file.

Scenario requirements

For this scenario, we will assume following requirements:

  1. vCenter 7.0.1 or latest with at least one ESXi 
  2. RHEL 8 installation DVD
  3. Ansible
  4. vmware.vmware_rest collection installed with latest version

Preparing Installation ISO file

We will be automating RHEL 8 installation using the Kickstart file fetched via iso image file. We will not discuss Kickstart file creation and management as this has already been covered in the documentation. You might want to visit Kickstart Info Access Labs to refresh your knowledge.

Gathering information about infrastructure

We will use environment variables to specify VMware credentials. This will make playbooks short and tidy. In order to do this, you need specify following environment variables:

  • VMWARE_HOST
  • VMWARE_USER
  • VMWARE_PASSWORD
  • VMWARE_VALIDATE_CERTS

Let us now start with our playbook which will create the virtual machine in vCenter. All modules in vmware.vmware_rest Collection use VMware managed object ID (MoID) for identifying and  referencing VMware objects. The MoIDs are unique in the given vCenter so there is no need to specify names and folders. 

We need to provide information where the virtual machine is going to be placed. This information comprises MoIDs of cluster, datastore, folder and resource pool. We can use existing modules from vmware.vmware_rest Collection to collect this information.

- name: Get Cluster info
   vmware.vmware_rest.vcenter_cluster_info:
         filter_names:
         - "{{ cluster_name }}"
   register: cluster_info

 - name: Get Resource info for {{ cluster_name }}
   vmware.vmware_rest.vcenter_cluster_info:
         cluster: "{{ cluster_info.value[0].cluster }}"
   register: resource_pool_info

 - name: Get datastore info
   vmware.vmware_rest.vcenter_datastore_info:
         filter_names:
         - "{{ datastore_name }}"
   register: datastore_info

 - name: Get folder info
   vmware.vmware_rest.vcenter_folder_info:
         filter_names:
         - '{{ folder_name }}'
   register: folder_info

We will need information about the standard portgroup to which the virtual machine is going to be attached to. Gathering information about the MoID of a standard portgroup can be done using vmware.vmware_rest.vcenter_network_info module.

- name: Get a list of the networks with a filter
vmware.vmware_rest.vcenter_network_info:
      filter_types: STANDARD_PORTGROUP
      filter_names:
      - "VM Network"
register: network_info

Creating a virtual machine

Once we have all the information required for create a virtual machine, let us move on to the module which creates the virtual machine that is vcenter_vm:

- name: Create a VM
  vmware.vmware_rest.vcenter_vm:
      boot:
      delay: 0
      enter_setup_mode: false
      retry: false
      retry_delay: 10000
      type: "BIOS"
      boot_devices: []
      cdroms:
      - allow_guest_control: true
        backing:
          type: "ISO_FILE"
          iso_file: "[ds_200] iso/rhel_8.3_ks.iso"
        ide:
          master: true
          primary: true
        label: "CD/DVD drive 1"
        start_connected: true
        type: "IDE"
      cpu:
      cores_per_socket: 1
      count: 1
      hot_add_enabled: false
      hot_remove_enabled: false
      disks:
      - new_vmdk:
           capacity: 536870912
        label: "Hard disk 1"
        scsi:
          bus: 0
          unit: 0
        type: "SCSI"
      guest_OS: "OTHER_LINUX_64"
      hardware_version: "VMX_13"
      memory:
      hot_add_enabled: true
      size_MiB: 4096
      name: test_vm_3
      nics:
      - start_connected: true
        type: VMXNET3
          mac_type: GENERATED
          backing:
            type: STANDARD_PORTGROUP
            network: "{{ network_id }}"
      scsi_adapters:
      - label: "SCSI controller 0"
        scsi:
          bus: 0
          unit: 7
        sharing: "NONE"
        type: "PVSCSI"
      placement:
       datastore: '{{ datastore_id }}'
       folder: '{{ folder_id }}'
       resource_pool: '{{ resource_pool_id }}'
  register: vm_info

Here, we specified to create a virtual machine with 4 GB memory with 1 single NIC attached to "VM network". Additionally, we attached a CDROM to this virtual machine for installation DVD with kickstart file inside it. 

You can power on the virtual machine using following tasks:

- name: Turn the power-on the VM
   vmware.vmware_rest.vcenter_vm_power:
         state: start
         vm: '{{ vm_info.id }}'

After powering on the virtual machine, installation will start as default option with the given kickstart file:

rhel blog one

Boot menu with Kickstart file as default option

rhel blog two

Linux Kernel boot parameters

It will take some time to install the new operating system, depending upon the configurations. You can mark this newly installed virtual machine as a template and can use it for clone operation.

Conclusion & Where to go next

Combining this Collection with vmware.vmware_rest, Ansible users can better manage virtual instances on VMware infrastructure with faster iterations and easier maintenance. 

Ansible lets you connect the different technologies with your VMware infrastructure that are ultimately needed to be successful in your efforts. 

The Collection vmware.vmware_rest is a solid foundation for VMware automation, which is coming in the near future. We're always looking to improve to help users like you get things done in more simplified, faster ways.