Bullhorn #2

Ansible Bullhorn banner

The Bullhorn

A Newsletter for the Ansible Developer Community

Welcome to The Bullhorn, our newsletter for the Ansible developer community. If you have any questions or content you’d like to share, please reach out to us at the-bullhorn@redhat.com.


THE AWX PROJECT RELEASES 11.2.0

On April 29th, the AWX team released the newest version of AWX, 11.2.0. Notable changes include the use of collection-based plugins by default for versions of Ansible 2.9 and greater, the new ability to monitor stdout in the CLI for running jobs and workflow jobs, enhancements to the Hashicorp Vault credential plugin, and several bugfixes. Read Rebeccah Hunter’s announcement here. For more frequent AWX updates, you can join the AWX project mailing list.


ANSIBLE 101 WITH JEFF GEERLING: EPISODE 7

In the latest video of his Ansible 101 series, Jeff Geerling explores Ansible Galaxy, ansible-lint, Molecule, and testing Ansible roles and playbooks based on content in his bestselling Ansible book, Ansible for DevOps. You can find the full channel of his Ansible videos here
 

POLL: DATES FOR NEXT ANSIBLE CONTRIBUTOR SUMMIT

We’re planning our next full-day virtual Ansible Contributor Summit sometime in late June or early July, and we’re looking for feedback on proposed dates. Carol Chen has posted a Doodle poll with options for possible dates; if you’re interested in attending, please fill out the poll so that we know which dates are best for everyone. We will close the poll on Friday, May 22nd.
 

PROOF OF CONCEPT: SERVERLESS ANSIBLE WITH KNATIVE

William Oliveira has built a new proof-of-concept for using Ansible and Knative to create event-driven playbooks. The proof-of-concept is a web application that can execute playbooks on demand and send those events to a Knative Event Broker to trigger other applications. Find the source code on GitHub here


COMMUNITY METRIC HIGHLIGHT: COMMUNITY.GENERAL COLLECTION

As the Ansible community continues to grow, we rely increasingly on metrics to keep track of our progress towards our goals. Following on from the more general metrics in Issue 1, we've also started to think about what special handling we might need in addition to metrics for all collections. Community.general is one such special case — as the home for most modules in Ansible, it sees a lot of contributors come and go, and content there can run the risk of becoming unmaintained. We need to watch this repository carefully so that we can act as needed.

Below is one graph from the dashboard we're preparing on this. This graph shows the rate of opened and closed issues per week, as well as a simple statistical test to see if the slope is non-zero. Currently both are essentially flat, suggesting opening and closing of issues is balanced. We've already got several graphs on this report, and we'll be adding more in the future.


ANSIBLE VIRTUAL MEETUPS

The following virtual meetups are being held in the Ansible community over the next month:


Ansible Minneapolis: CyberArk’s integration with Ansible Automation

Thu, May 21 · 6:30 PM CDT

https://www.meetup.com/Ansible-Minneapolis/events/sbqkgrybchbcc/


Ansible Northern Virginia: Spring Soiree!

Thu, May 21 · 4:00 PM EDT

https://www.meetup.com/Ansible-NOVA/events/270368639/


Ansible Paris: Webinar #1

Thu, May 14 · 11:00 AM GMT+2

https://www.meetup.com/Ansible-Paris/events/270584272/


We are planning more virtual meetups to reach a broader audience, and we want to hear from you! Have you started using Ansible recently, or are you a long-time user? How has Ansible improved your workflow or scaled up your automation? What are some of the challenges you’ve faced and lessons learned? Share your experience by presenting at a Virtual Ansible Meetup: https://forms.gle/aG5zpVkXDVMHLERX9

You’ll have the option to pre-record the presentation, and be available during the meetup for live Q&A, or deliver the presentation live. We will work with you on the optimal set up, and share with you some cool Ansible swag!


FEEDBACK

Have any questions you’d like to ask, or issues you’d like to see covered? Please send us an email to the-bullhorn@redhat.com.


AnsibleFest 2020 is now a virtual experience

AnsibleFest 2020 is now a virtual experience

Each year, AnsibleFest is one of our favorite events because it brings together our customers, partners, community members and Red Hatters to talk about the open source innovations and best practices that are enabling the future of enterprise technology and automation.

Because the safety of our attendees is our first priority, we have decided to make AnsibleFest 2020 a virtual experience. We are excited to connect with everyone virtually, and look forward to expanding our conversation across the globe. By changing our event platform, we hope to use this opportunity to collaborate, connect, and chat with more automation fans than ever before. It is exciting to think about how many more people will be able to join in on the automation conversation.

The AnsibleFest Virtual Experience will be a free, immersive multi-day event the week of October 12th, 2020, that will deliver timely and useful customer keynotes, breakout sessions, direct access to Ansible experts, and more. You will want to sign up to stay connected and up-to-date on all things AnsibleFest. 

Call for proposals is open

We are still working through the details for the virtual event, but are very excited to announce that the call for proposals is now open through July 15. We will post additional information on the Ansible Blog and on the AnsibleFest site as it becomes available. Stay tuned! 

We look forward to hosting this event and thank you all in advance for your collaboration to make this a great success. 

Frequently Asked Questions

Why did you cancel the in-person AnsibleFest event?

We have been closely monitoring the feasibility of the physical event in San Diego and have decided to rebuild AnsibleFest 2020 as a virtual event. Our goal is to serve and support AnsibleFest attendees with a virtual celebration that captures the immersive AnsibleFest experience, and allows us to welcome an even larger audience than usual.

What will you be doing instead of an in-person event?

We will be hosting the AnsibleFest Virtual Experience, a free, immersive multi-day event from October 13-14, 2020, that delivers the same inspiring content from AnsibleFest 2020 - keynotes, breakout sessions, access to experts, and more.  We are still working through many of the details for the virtual event, but we are excited about the opportunity to share content selected to help you transform your organization by delivering the right Automation strategy, combined with the cultural change needed to succeed in the constantly  evolving digital journey.

In the current world of Cloud and DevOps, Automation can be used to enable open ways of working in order to build business resilience and innovation.

How do I register for  the AnsibleFest virtual experience?

Information and details on registration will be announced within the month of June. Follow Red Hat Ansible - \@ansible on Twitter and sign up for information on our site www.ansiblefest.com  to get all information as it becomes available.  

Will there be sponsorship opportunities for the AnsibleFest virtual experience?

Yes, there will be sponsorship opportunities available. These will be released later this summer. Questions? Please reach out to the sponsorship team

Will you be having any in-person events later?

We are exploring that situation, and will announce any plans we have.  But for now, we hope you can join our virtual experience on October 13-14!

When is AnsibleFest in 2021?

A date has not been set for AnsibleFest in 2021.

What kind of software will be required to view keynotes and interact with the experts at the virtual event? Will users have to install anything?

It will be web-based, so all you will need is a computer with a supported browser and an internet connection capable of streaming video. This page has requirements for desktop browser and operating systems.

I booked my air travel already.  Can I get a refund?

We're announcing this well ahead of time in the hopes that we reach our attendees before they've booked travel. Unfortunately, we are unable to provide a refund for your air travel.  Check with your airline or travel agency.  Many airlines are waiving change fees or providing credits for airfare.


Active Directory and Ansible Tower

Active Directory & Ansible Tower

Welcome to the second installment of our Windows-centric Getting Started series!

Last time we walked you through how Ansible connects to a Windows host. We've also previously explored logging into Ansible Tower while authenticating against an LDAP directory. In this post, we'll go over a few ways you can use Ansible to manage Microsoft's Active Directory. Since AD plays a role in many Windows environments, using Ansible to manage Windows will probably include running commands against the Active Directory domain.

First, Set Your Protocol

We'll be using WinRM to connect to Windows hosts, so this means making sure Ansible or Tower knows that. Machine credentials in Ansible Tower can be created and used along with variables, but when using Ansible in a terminal the playbook should make it clear with variables:

---
- name: Your Windows Playbook
  hosts: win
  vars:
    ansible_ssh_user: administrator
    ansible_ssh_pass: ThisIsWhereStrongPassesGo
    ansible_connection: winrm
    ansible_winrm_server_cert_validation: ignore

- tasks:

Along with using the local admin account/pass, the WinRM connection method is named specifically. The variable to ignore the certificate validation is for standalone, non-domain hosts because a domain-joined instance should have certificates validated on the domain.

Where's the Domain?

Speaking of domains, Ansible can spin up a new domain if one doesn't exist.

In the following example, Ansible (using the previous settings) installs the AD Domain Services features from Server Management win_feature, and if there's no domain present it creates the new Active Directory domain with the provided AD safe mode password win_domain:

- name: Install AD Services feature
  win_feature:
    name: AD-Domain-Services
    include_management_tools: yes
    include_sub_features: yes
    state: present
  register: result

- name: Create new forest
  win_domain:
    dns_domain_name: tycho.local
    safe_mode_password: RememberTheCant!
  register: result

- name: Reboot after creation
  win_reboot:
    msg: "Server config in progress; rebooting..."
  when: result.reboot_required

After creating the domain, the server sends a message to anyone logged in that the server is rebooting and then commences to reboot. While not a production-quality playbook, this is a good example of what can be configured quickly with a few short plays.

If there's already a domain present for testing there's no need to create one, but there may be a test machine that should be joined to an existing domain. Ansible can similarly shorten that task with a few plays as well:

- name: Configure DNS
  win_dns_client:
    adapter_names: "Ethernet 2"
    ipv4_addresses:
    - 10.0.0.1

- name: Promote to member
  win_domain_membership:
    dns_domain_name: tycho.local
    domain_admin_user: drummer@tycho.local
    domain_admin_password: WeNeed2Hydrate!
    state: domain
  register: domain_state

- name: Reboot after joining
  win_reboot:
    msg: "Joining domain. Rebooting..."
  when: domain_state.reboot_required

The steps are self-explanatory, make sure the machine can communicate with the directory server (win_dns_client), then join to the domain (win_domain_membership). The target restarts to complete joining the directory. Quick and easy.

What Can It Do?

Using the win_feature to manage the roles is similar to the combination of the Install-WindowsFeature and Add-WindowsFeature Powershell cmdlet. If you're not familiar with the name used for the feature you're trying to install, use the Get-WindowsFeature cmdlet to list available features to install.

The Windows domain modules ( win_domain, win_domain_controller, win_domain_group, win_domain_membership, win_domain_user ) cover the common tasks run against an Active Directory. For most of the Windows modules a domain account with appropriate privileges should be set as a machine credential (using DOMAIN/User or User@domain.tld), much like you would for a local account.

To Conclude

In this post, we used WinRM to connect to Windows hosts, had Ansible install the AD Domain Services features from Server Management using the win_feature module (or created the new Active Directory domain if there isn't one already present by using the win_domain module), made sure the machine can communicate with the directory server using win_dns_client, then joined it to the domain using win_domain_membership.

Don't forget to make sure that your playbook for Windows nodes sets the connection variables by specifically stating ansible_connection: winrm (required) as well as ansible_winrm_server_cert_validation: ignore (if you haven't added your local CA as trusted). As shown in the beginning of this post, those two variables go along with the connecting account variables after vars: in an Ansible Playbook. In Ansible Tower, those variables go in the job template.

So now you know how to use Ansible with Microsoft's Active Directory! In our next post, we'll dive deeper into the package management abilities you have with Ansible and Windows!


Red Hat Ansible Tower Monitoring Using Prometheus, Node Exporter, and Grafana

Red Hat Ansible Tower Monitoring Using Prometheus, Node Exporter, and Grafana

A crucial piece of automation is ensuring that it runs flawlessly. Automation Analytics can help by providing insight into health state and organizational statistics. However, there is often the need to monitor the current state of  Ansible Tower. Luckily, Ansible Tower does provide metrics via the API, and they can easily be fed into Grafana.

This blog post will outline how to monitor Ansible Tower environments by feeding Ansible Tower and operating system metrics into Grafana by using node_exporter & Prometheus.

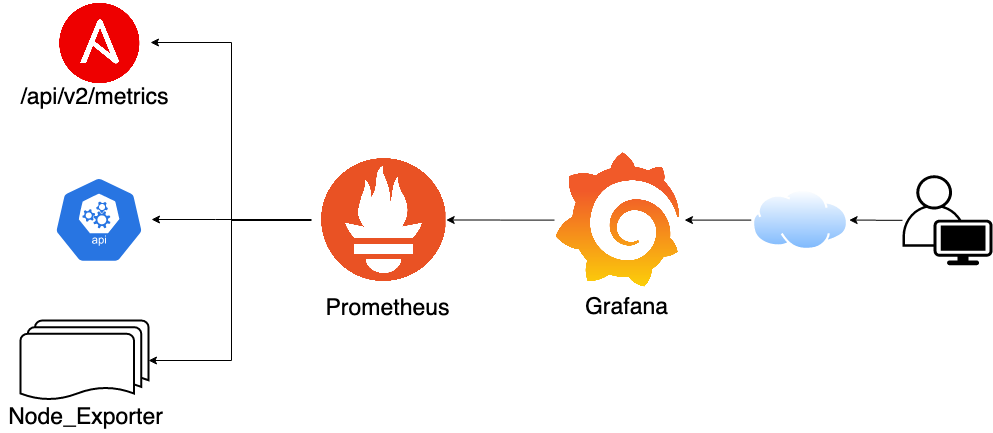
To reach that goal we configure Ansible Tower metrics for Prometheus to be viewed via Grafana and we will use node_exporter to export the operating system metrics to an operating system (OS)  dashboard in Grafana. Note that we use Red Hat Enterprise Linux 8 as the OS running Ansible Tower here. The data flow is outlined below:

analytics data flow diagram

As you see, Grafana looks for data in Prometheus. Prometheus itself collects the data in its database by importing them from node_exporters and from the Ansible Tower APIs.

In this blog post we assume a cluster of three Ansible Tower instances and an external database. Also please note that this blog post assumes an already installed instance of Prometheus and Grafana.

Setup  of node_exporter

As a first step we will set up node_exporter on the Ansible Tower servers and the external database. Since node_exporter is not available in Red Hat Enterprise Linux 8 by default we first have to install it. To do that we login to our Ansible Tower server, clone the corresponding git repository and change into the repository directory. See the listing shown below for reference:

$ git clone https://github.com/redhat-cop/tower_grafana_dashboards 

$ cd tower_grafana_dashboards/

$ tree
.
├── install_node_exporter.yaml
├── metric_servers.json
└── metric_tower.json

0 directories, 3 files

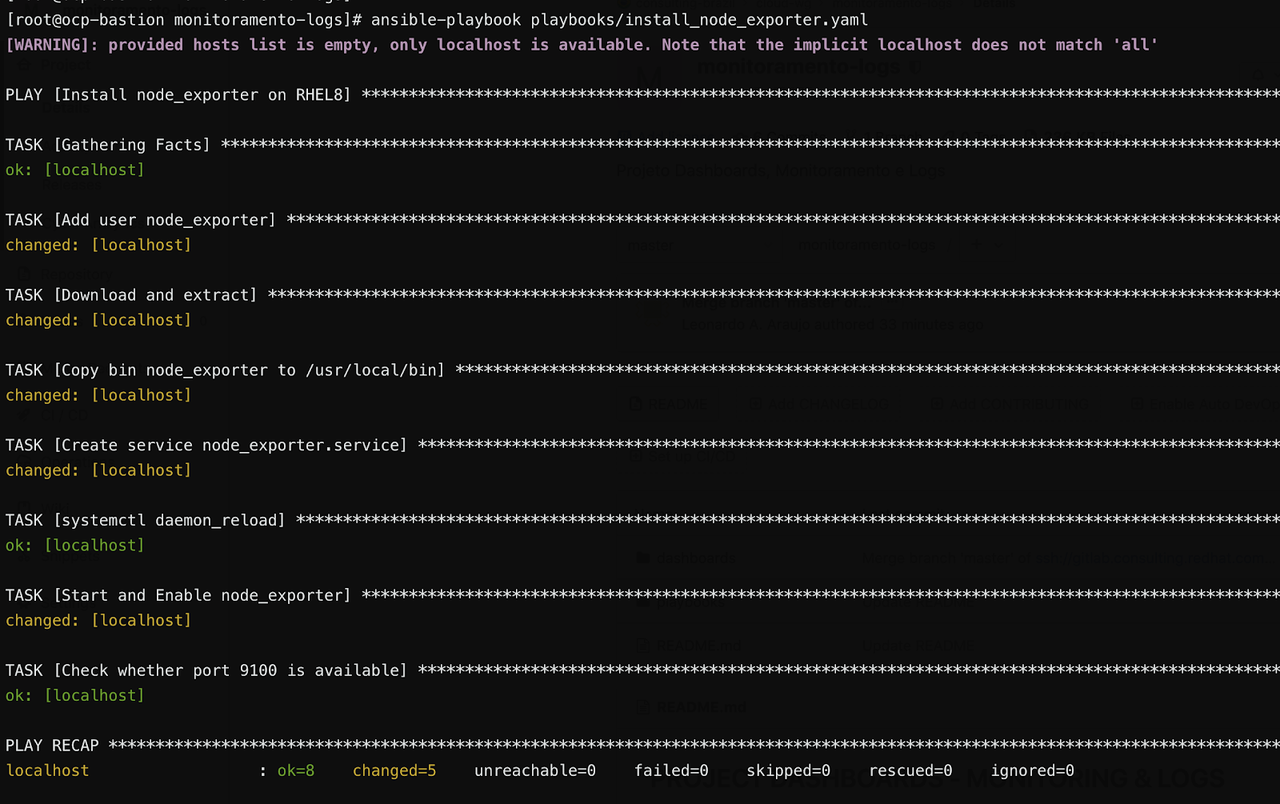
Next, we have to perform the actual installation of node_exporter. Luckily, a playbook to install it is included. Run the install_node_exporter.yaml playbook to perform the installation of node_exporter. 

$ ansible-playbook install_node_exporter.yaml
...

The output of the playbook is shown below:

Analytics blog 2

After the installation, verify if node_exporter is indeed running and listens on port 9100. This can easily done with netstat:

analytics blog 3

Repeat these steps on the other Ansible Tower servers as well as on the external database.

Validating Ansible Tower metrics

Next let's shift our focus towards Ansible Tower. Validate that the Ansible Tower metrics are being displayed correctly by accessing the url below:

https://tower.customer.com/api/v2/metrics

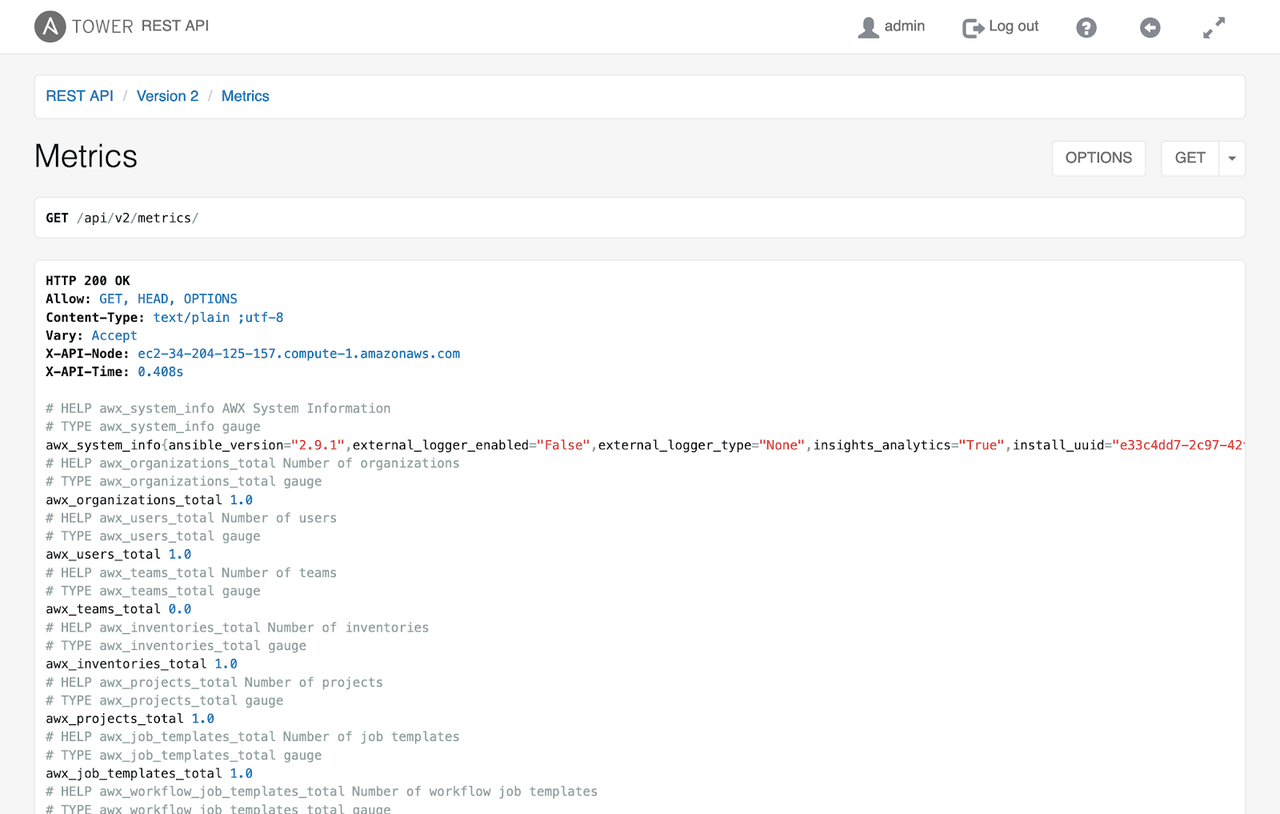
Accessing the url we should see a listing of all available Ansible Tower metrics, as shown below:

analytics blog 4

Let's  set up Prometheus to gather these data. First we need to generate an authentication token on Ansible Tower: the token will grant access to Ansible Tower without the need to enter username and passwords each time it is accessed.

To generate the token, access the Ansible Tower console and click on your username that appears at the top of the page. From there, click on "Tokens" and then on the + sign. A new window pops up where you can define the specifics of the token and finally create it, see the image below. Choose the scope "read" and click the green "SAVE" button.

analytics blog 5

Setting up Prometheus to receive metrics

With the token in our hands, we can now configure Prometheus, adding the node_exporters scrape config and the scrape for Ansible Tower's metrics. Open the configuration of your Prometheus installation with an editor of your choice: 

$ vim /etc/prometheus/prometheus.yml

Next, add the configuration for Ansible Tower and the operating system. Below is an example:

## Scrape Config - Tower
  - job_name: 'tower'
    metrics_path: /api/v2/metrics
    scrape_interval: 5s
    scheme: https
    bearer_token: xxxxxxxxxxxxxxxx (your bearer token)
    static_configs:
    - targets:
      - tower.customer.com

## Add Node Exporter
  - job_name: 'tower-01'
    scrape_interval: 5s
    static_configs:
    - targets: ['172.31.66.203:9100']

  - job_name: 'tower-02'
    scrape_interval: 5s
    static_configs:
    - targets: ['172.31.65.135:9100']

  - job_name: 'tower-db-01'
    scrape_interval: 5s
    static_configs:
    - targets: ['172.31.64.218:9100']

Note that the metrics for Ansible Tower are only collected once, while the operating system metrics are collected for each server: Ansible Tower helps ensure that all internal metrics are already collected and shared among all installed servers of the cluster. But each operating system on each server is independent and thus has independent OS metrics.

Restart Prometheus to apply the changes:

$ systemctl restart prometheus

Now, access the url http://prometheus.customer.com/targets to validate that the data are scraped properly. Ensure that , all endpoints are in UP status as shown below:

analytics blog 6

Grafana configuration to import the dashboards

Now let's import the dashboards into Grafana. Grafana can be configured through json files. In the repo mentioned above we provide two json files to configure two dashboards: metric_servers.json for the OS metrics, and metric_tower.json for the Ansible Tower metrics. Let's import them into Grafana to enable the dashboards.

To do that, access your Grafana installation and click on the + sign in the navigation menu on the left side. Pick "Folder",  enter a desired name and create it.

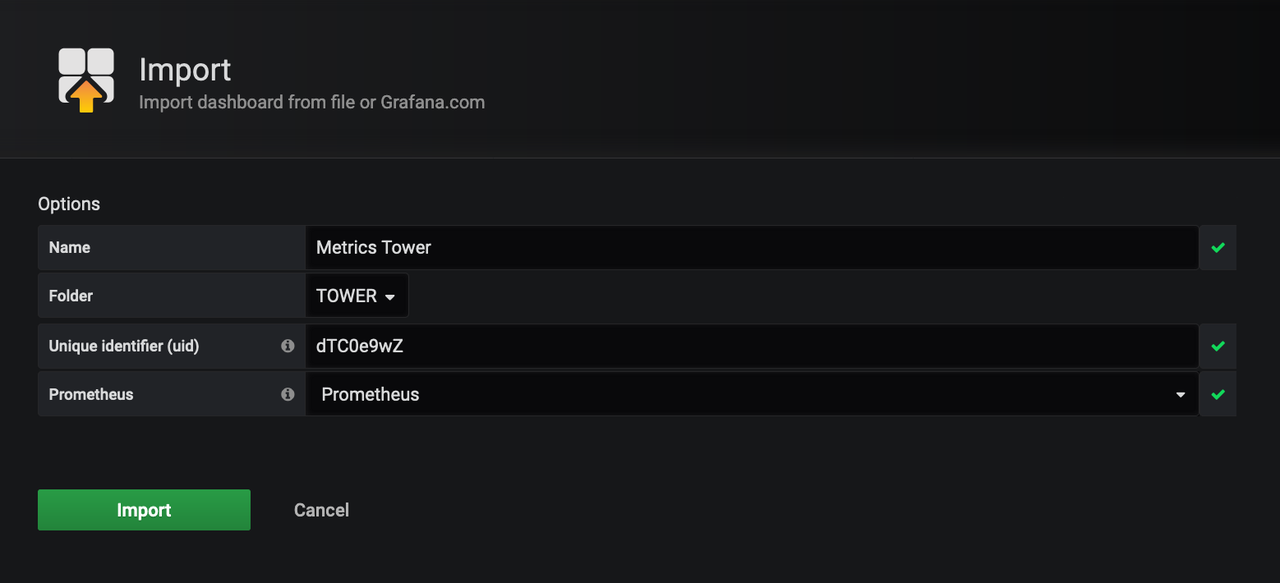
Afterwards we have the option to "Manage Dashboards", from where we can import the prepared json file via upload. Select the json file metric_tower.json, choose the just created folder, change the uid and choose the datasource as Prometheus as shown below:

analytics blog 7

Initiate the import by pressing the corresponding button. After the import of metric_tower.json is finished, we repeat the same process for the metric_servers.json file.

The new Grafana dashboards

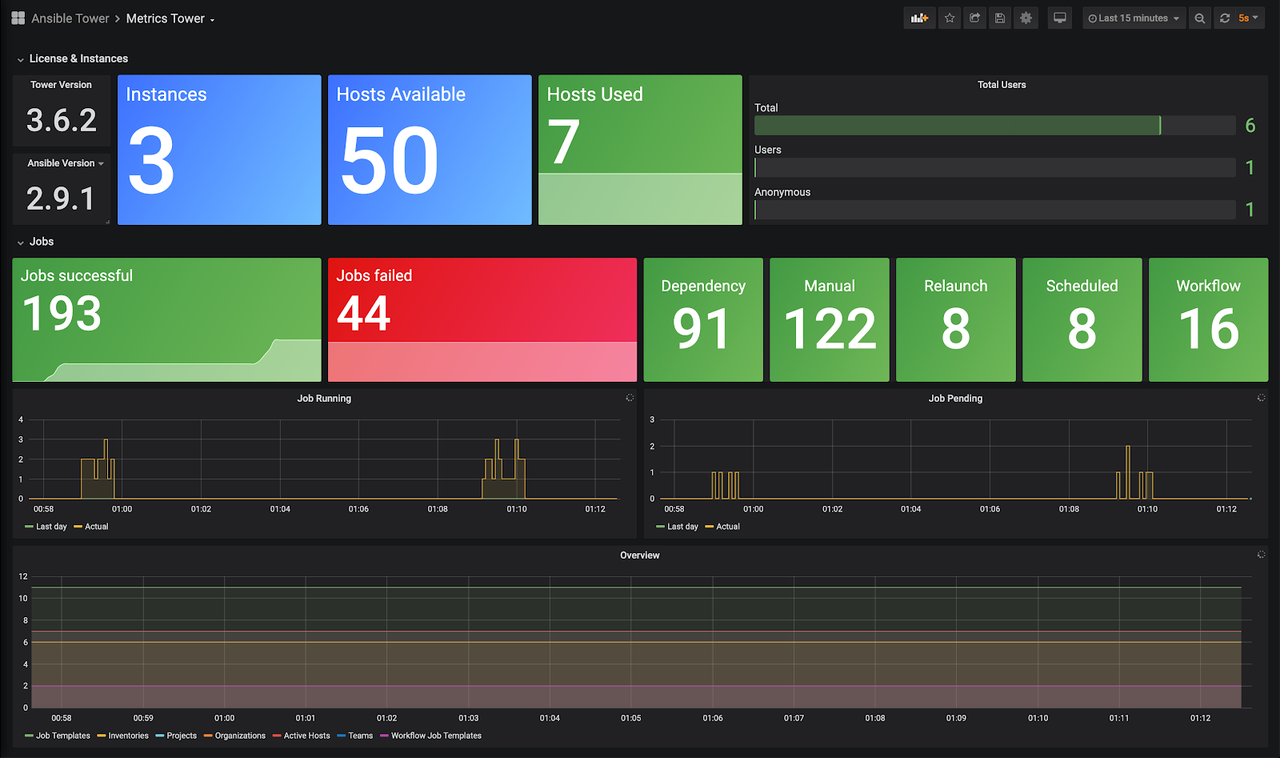
Once both uploads are finished, we can view the imported dashboards:

analytics blog 8

In this Ansible Tower metrics dashboard, you can now see the following information:

  • Ansible Tower Version 
  • Ansible Automation Platform Version
  • number of tower nodes
  • number of hosts available in the license
  • number of hosts used
  • total users
  • jobs successful
  • jobs failed
  • quantity by type of job execution
  • graphics showing the number of jobs running and pending jobs
  • graph showing the growth of the tool showing the amount of workflow, hosts, inventories, jobs, projects, organizations, etc.

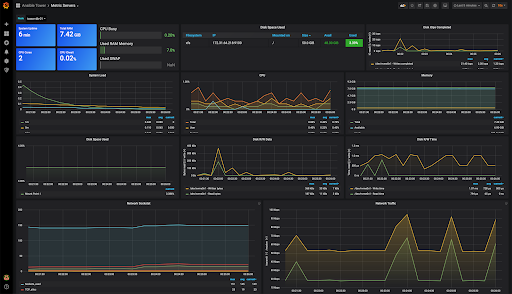
In the Operating System metrics dashboard, we have the following information:

  • Uptime
  • total vcpus
  • total memory
  • cpu iowait
  • memory consumption
  • cpu busy
  • Swap
  • filesystem consumption
  • disk iops
  • system load
  • used space graph
  • graphics with disk writing and reading, network traffic and network sockets.

analytics blog 9

Takeaways and where to go next

In this post, we demonstrate how to create a monitoring of your Ansible Tower environment using node_exporter to export metrics from the OS and Prometheus collecting the metrics of the Ansible Tower api, we include the OS consumption dashboards and Ansible Tower metrics, so that you have a view more managerial of your environment, such as capacity, licensing and jobs in execution, using graphics and counters, you can identify problems and take actions quickly.

If you're interested in detailed views across your entire automation environment, you can also try Automation Analytics on cloud.redhat.com.


Introducing the AWX and Ansible Tower Collections

Introducing the AWX and Ansible Tower Collections

Ansible Content Collections are a new way of distributing content, including modules, for Ansible. 

The AWX and Ansible Tower Collections allow Ansible Playbooks to interact with AWX and Ansible Tower. Much like interacting with AWX or Red Hat Ansible Tower via the web-based UI or the API, the modules provided by the AWX Collection are another way to create, update or delete objects as well as perform tasks such as run jobs, configure Ansible Tower and more. This article will discuss new updates regarding this collection, as well as an example playbook and details on how to run it successfully.

The AWX Collection awx.awx is the upstream community distribution available on Ansible Galaxy.  The downstream supported Ansible Collection ansible.tower is available on Automation Hub alongside the release of Ansible Tower 3.7.

This collection is a replacement for the Ansible Tower web modules which were previously housed and maintained directly in the Ansible repo. The modules were initially added to the AWX source in October of 2019, when collections work began; the tower_* modules in Ansible Core were marked for official migration shortly after. 

Improvements in the AWX Collection

The modules delivered by Ansible Core and the initial versions of the AWX Collection had a dependency on libraries provided by the tower-cli project.  Due to the deprecation of tower-cli, there is work currently being done to remove that dependency. This has led to a major update to the AWX Collection.

During the removal of tower-cli, we have tried to keep the modules backwards-compatible with their corresponding version that shipped in Ansible Core. This way, if you have already leveraged the tower_* modules from Ansible Core, there should be very little work required when switching to the AWX Collection. For more information, see the Deprecation Updates section below.

In addition, we have standardized the modules' operational logic, thus making the collections modules more uniform. Previously, each module was written individually (sometimes by different authors). This caused subtle differences of behavior for the individual modules. The modules distributed in the AWX Collection follow a standard pattern, which provides consistency even if written by different authors.

The syncing of the collection to the Red Hat Ansible Tower versions also allows the modules' parameters to be kept in sync with the options available within the web UI and API. As part of the recent changes, we have added some new tooling as well as updated many of the modules to now include parameters for functionality which have been added to Ansible Tower since the modules were initially released.

The collection now also provides better support for idempotency as well as check_mode. In previous versions using check_mode, older modules would simply ensure that they could connect to the Ansible Tower server but not indicate if they would have actually made a change to an Ansible Tower object. The AWX Collections modules will now more accurately indicate if they would have changed a Tower object via check_mode. 

Using the AWX Collection

It's very easy to get started with AWX Collection; all you need to do is install the collection from Ansible Galaxy in order to interact with Ansible Tower. This can be done with the command:

ansible-galaxy collection install awx.awx

Once the collection is installed, we can begin writing playbooks to manage your instance of Ansible Tower.

Note: In order to communicate with your Red Hat Ansible Tower environment, you need to have an instance of it running, with a dedicated Ansible Tower host address.  

Setting Up Authentication

The first thing we need to do in order to interact with Red Hat Ansible Tower is provide authentication. This can be done in several ways, all of which are backwards-compatible with the old version of the modules. The following authentication options are available for use:

  • Specify the connection information as module parameters
  • Provide environment variables with the connection information
  • Reference an old tower_cli.cfg file that contains the connection information

Below is an example of a tower_cli.cfg file:

host: [$HOST_ADDRESS]
verify_ssl: False
tower_username: [$TOWER_USERNAME]
tower_password: [$TOWER_PASSWORD]
oauth_token: [$OAUTH_TOKEN] (if using oauth instead of a password)

Creating a Playbook

Once you have the AWX Collection installed and your authentication method decided upon, we can begin writing a playbook to interact with Ansible Tower. In order to activate the collection, the following code snippet is required at the play level of your playbook:

  collections:
    - awx.awx

Even if you are running on a version of Ansible that still ships with the tower_* modules, this will cause Ansible to load the modules from the AWXCollection instead of the versions shipped in Ansible Core. The rest of your playbook would look identical to a playbook that did not use the collection. 

In the example playbook below, the authentication information is not specified in the tasks and would be loaded either from the environment variables or a tower_cli.cfg file:

---
- name: Playbook for Using a Variety of Tower Modules
  hosts: localhost
  gather_facts: false
  collections:
    - awx.awx

  tasks:

  - name: Create a new organization
    tower_organization:
      name: "New Org"
      description: "test org"
      state: present

  - name: Create an Inventory
    tower_inventory:
      name: "New Inventory"
      description: "test inv"
      organization: "New Org"
      state: present

  - name: Create a Host
    tower_host:
      name: "New Host"
      inventory: "New Inventory"
      state: present
      variables:
        foo: bar

  - name: Create a Project
    tower_project:
      name: "New Project"
      organization: "New Org"
      scm_type: git
      scm_url: https://github.com/ansible/test-playbooks.git

  - name: Create a Team
    tower_team:
      name: "Test Team"
      description: "test team"
      organization: "New Org"
      state: present
      validate_certs: false

  - name: Create a Job Template
    tower_job_template:
      name: "Job Template to Launch"
      project: "New Project"
      inventory: "New Inventory"
      playbook: debug.yml
      ask_extra_vars: yes

  - name: Launch the Job Template (w/ extra_vars)!
    tower_job_launch:
      job_template: "Job Template to Launch"
      extra_vars:
        var1: My First Variable
        var2: My Second Variable
        var3: My Third Variable

Note: Another way to tell Ansible to use a module from a collection is to fully qualify the modules' name with the collection namespace, as in this example below:

 - name: Launch the Job Template (w/ extra_vars)
    awx.awx.tower_job_launch:
      job_template: "Job Template to Launch"
      extra_vars:
        var1: My First Variable
        var2: My Second Variable
        var3: My Third Variable

Executing the Playbook

Assuming that the playbook above was saved in your current directory as a file named configure_tower.yml, the following command would run this playbook:

$ ansible-playbook -i localhost configure_tower.yml

Note: If you have issues with Python on your machine, changing the ansible-playbook command to the following might help:

$ ansible-playbook -i localhost -e ansible_python_interpreter=$(which python) configure_tower.yml

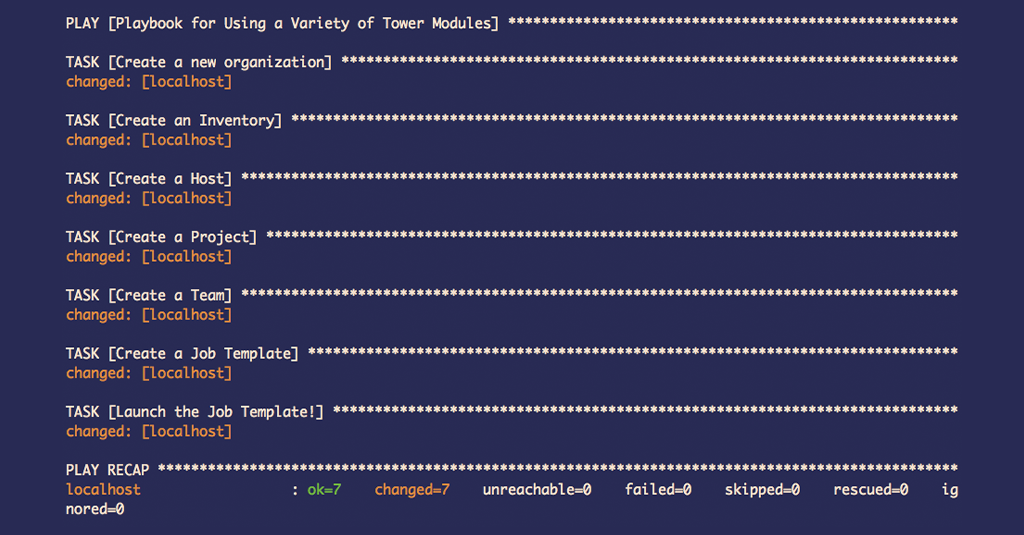
With a properly-installed collection, configured authentication setup and a correctly-formatted playbook, you should see output similar to this:

ansible-blog-screenshot-awx-collection

Upon completion of the playbook, If you navigate to the web UI of your Red Hat Ansible Tower server, you should be able to see that the following objects were created:

  • An organization called "New Org"
  • An inventory called "New Inventory" and host called "New Host" within that inventory
  • A project called "New Project"
  • A team called "New Team"
  • A job template called "Job Template to Launch"

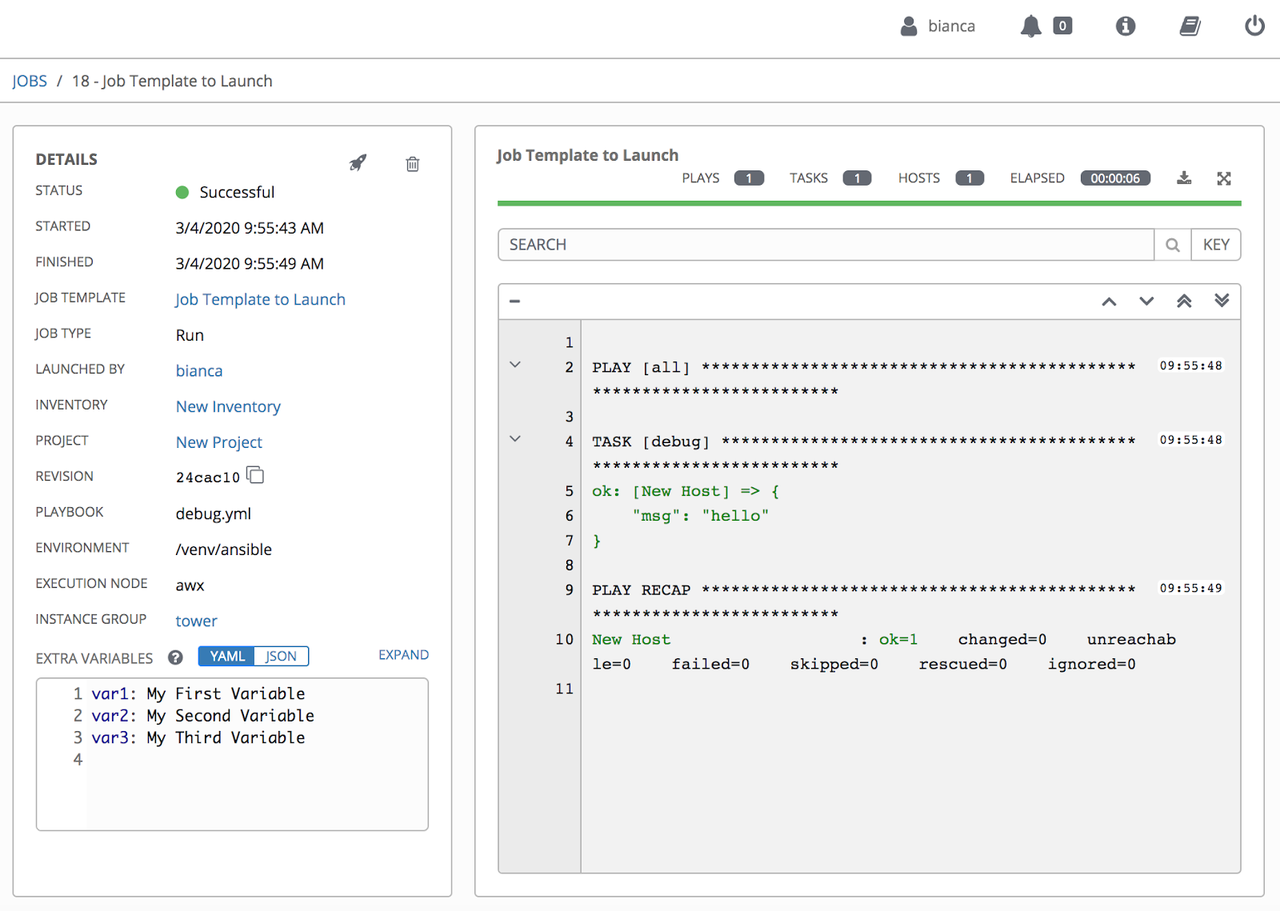
In addition, you can see on the Jobs page that the playbook invoked the job template with the specified extra_vars.  See below:

bianca collections tower ui

Deprecation Updates

During the removal of tower-cli, we attempted to keep the modules as similar as possible to ease the transition from the old Core modules to the new collection. Inevitably, some minor changes had to be made; details of these changes can be found in the "Release and Upgrade" section of the AWX Collections README.md file. Some changes to mention include:

  • extra_vars parameters no longer support load of variables from a file by specifying a @<file name> notation. Instead, they now take dictionaries. If you were previously loading a file, please use the lookup plugin to load the file instead.
  • Some modules no longer return values the way they used to. All returns have been unified across the modules and primarily return the ID of the object modified.

Conclusion

It is quite simple and straightforward to get up and running with the AWX Collection.  Amongst other things, collections enable users to store their most frequently-used tasks inside of different playbooks, which can be easily shared as needed.  In a follow-up blog post, we will discuss contribution and development, as well as how to test any new or updated modules you may want to add to the collection.